Finally, after a long time of silence, the new version of WPF Performance Profiling Tool is available for download for x32 and x64 OSs. So, what’s new there?
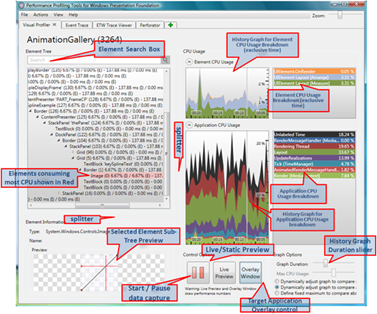
Ton of UI improvements for Visual Profiler
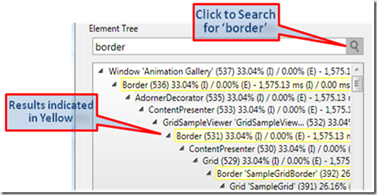
New search function to quick find elements in visual tree
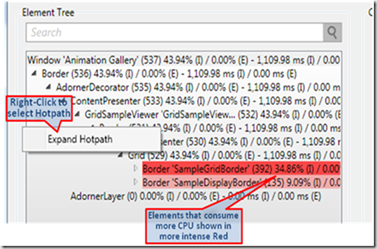
Hot path (critical path) of CPU usage aside with CPU usage for single element
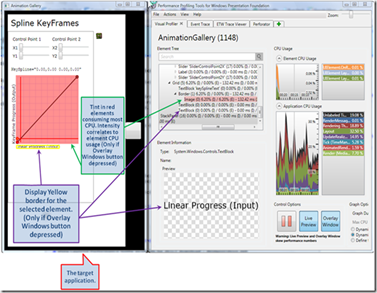
Configuration of tint for overlay windows
Live preview, ability to split columns, slider of graph duration, expanders to have cleaner screen and much much more
Perforator also got new UI and has history now.
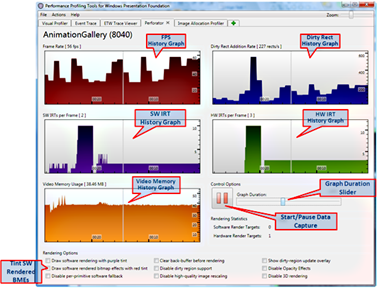
There is new tool, named String allocation profiler
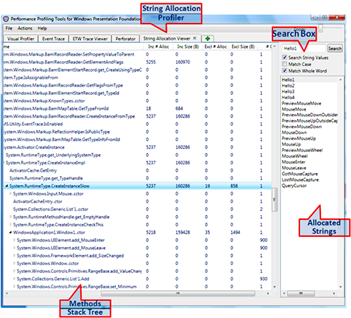
This tool is very useful for viewing and managing strings inside your application (another step toward normal localization support for WPF? Probably)
There are also some improvements in Event tracing tool. Select process for example :)
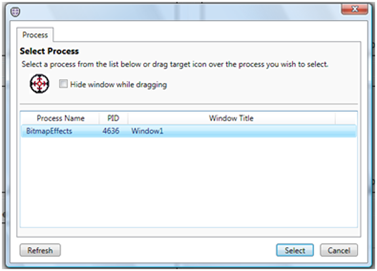
And much much more. Great thank to Josef and his team for this great work
Download the new version of WPF Performance Profiling Tool >>
No comments:
Post a Comment